What type of inflation affects your company
The expert Oscar Villalón indicates: “it is difficult that two companies are impacted in the same way by inflationary indexes”
Many entrepreneurs wait for official inflation data to adjust prices, budgets and other useful tools for decision making, after assuming that their company is affected by that same official index, which is a big mistake. This is stated by Oscar Villalón, MBA, director of the Financial Studies Institute, who added in a conversation and special report for Bitfinance.News that, this mistake is especially made in times of hyperinflation, where biases are usually quite large. “The real inflation of the company rarely will coincide with an official index that is due to the variation experienced by a basket of goods and services that may be very far from what a private entity consumes. To clarify this, it is convenient to recapitulate a little about this phenomenon and the instruments used to measure it.”
Villalón briefly explains that inflation is the generalized and sustained increase in all prices of goods and services that occur in an economy. It is widespread because it affects all goods and services, and sustained because it does not stop but keeps going up all the time although in different magnitudes. According to its intensity, inflation is usually classified into three types, he continues:
Moderate inflation: When the price increase does not reach 10% per year.
Galloping inflation: It occurs in the case of high inflation, between two and three digits.
Hyperinflation: According to the definition of Phillip Cagan of 1956, it is reached when for 6 consecutive months inflation is greater than 50% per month and ends when it is below that rate for a year.
Another very pernicious phenomenon in an economy is what is known as stagflation, from English terms stagnation and inflation. And that occurs when stagnation comes in the middle of an inflationary process. That is, the worst of both worlds. The figures that have been given in recent years in Venezuela are so high that we would have to talk about hyperstagflation, that is, an inflation so high that it resulted in hyperinflation and a stagnation so acute that it reduced the product by almost 70% in 6 years.
In fact, in the Venezuelan case official figures are expressed as follows:
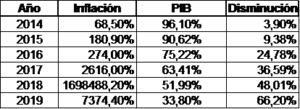
Although in 2019 inflation slowed, we continue to suffer hyperinflation according to the definition of Phillip Cagan already mentioned. But if we add the huge cumulative fall in GDP, we have to accept that we are in hyperstagflation.
The crucial point for us is to see how inflation is measured. This is carried out using the so-called Price Indexes that are basically made with the following models.
Laspeyres: Designed by the German statistician and economist Ettienne Laspeyres, a part of a “q” basket weighted by “p” of goods and services at a given date and compares exactly to the same basket with the prices that are registered at later dates “tn”. Only “p” prices vary over time, not “q” quantities:

Thus, monthly the basket valued at “tn” prices compared to the basket at prices will show the increase in the price variable for the month.
Paasche: Designed by the German statistician and economist Hermann Paasche has the same structure as Laspeyres, but instead of using the previous basket, he will use the current “tn” basket. Only prices vary, but the basket is the current one; ergo you have to change the denominator every month.
Paasche Index:

Also, only the impact of the variable “prices” is shown but the basket is the current one.
Fisher: Designed by the American statistician and economist Irving Fisher, he tries to balance the criticisms made to the Germans Laspeyres (which overvalue inflation) and Paasche (which underestimate inflation) by proposing a geometric average of the two previous indexes:
![]()
It is just the square root of the Laspeyres and Paasche indexes.
Due to its operational ease, it has always been preferred to measure inflation with the Laspeyres index, building a basket of goods and services in a base year and updating it from time to time to avoid obsolescence derived from population consumption patterns, says the director of the Financial Studies Institute.

But it is not only consumers who are interested in knowing the variation in prices – which in fact is a guide for public policies – but also for different fields of the economy such as services, construction, agriculture; regional, national and imported goods; wholesalers.
“Obviously the results may be similar but never the same. That is to say, there are more impacted sectors than others due to the inflationary phenomenon, depending on their cost and expense structure and their nature. Therefore, some managers can make serious mistakes if, when making decisions where the inflationary factor is important, they are guided by official consumer; national, regional or sectoral price indexes.” They may be put out of the market because they estimate in excess or face losses when estimating in default, says the expert.
Two companies are hardly impacted in the same way by inflation rates, especially in times of hyperinflation, or worst, in times of hyperstagflation. If one company depends to a greater extent on imported inputs and the devaluation rate goes below the inflation rate, it is possible that the inflationary impact is lower than that of another similar company that uses mostly national inputs. The same will happen in the opposite direction if at any given time the inflation rate goes below the devaluation rate.
Due to the above considerations, we allow ourselves to recommend that any company of importance that has to make decisions under conditions of uncertainty as in the case of Venezuela, it prepares its own index of past and projected inflation based on a thorough study of the sensitivity of the components of the cost of its products and services against the sectorial inflation rates, combined with the possible expected devaluation rates. This tool must act as a thermometer of the economic activity of the company and must always be updated, maximum monthly, although the specialist strongly recommends to do it biweekly.
M.Pino